Monitoring device health
Last updated
Was this helpful?
Last updated
Was this helpful?
This page provides insights into monitoring network and hardware-related statuses in the Device List section. Discover how to utilize these statuses for system configuration and maintenance purposes.
The Device List section allows you to monitor system statuses in real-time at various detail levels—system level, array level, or controller/module-specific.
For all statuses, HOLOPLOT Control represents the severity level in 4 statuses. Here is their meaning:
🟢 OK
Everything is functioning correctly. Sound can be played without issues.
Everything is functioning correctly. Operation is normal.
🟡 Warning
Sound can be played, there might be minor issues that compromise the system’s performance. Show can go on, but should be checked later on.
Controllers still function, but minor issues are observed. Show can go on, but should be checked later on.
🟠 Error
Modules can still make sound, but with severe degradation to system’s performance. Should be checked as soon as possible.
Controllers functionality is impacted, major issues are observed. Should be checked as soon as possible.
🔴 Critical
Modules are severely compromised and might not make sound.
Controllers cannot function properly.
⚪️ Unknown
Modules are not reporting any information, or we cannot accurately report its health.
Controllers are not reporting any information, or we cannot accurately report its health.
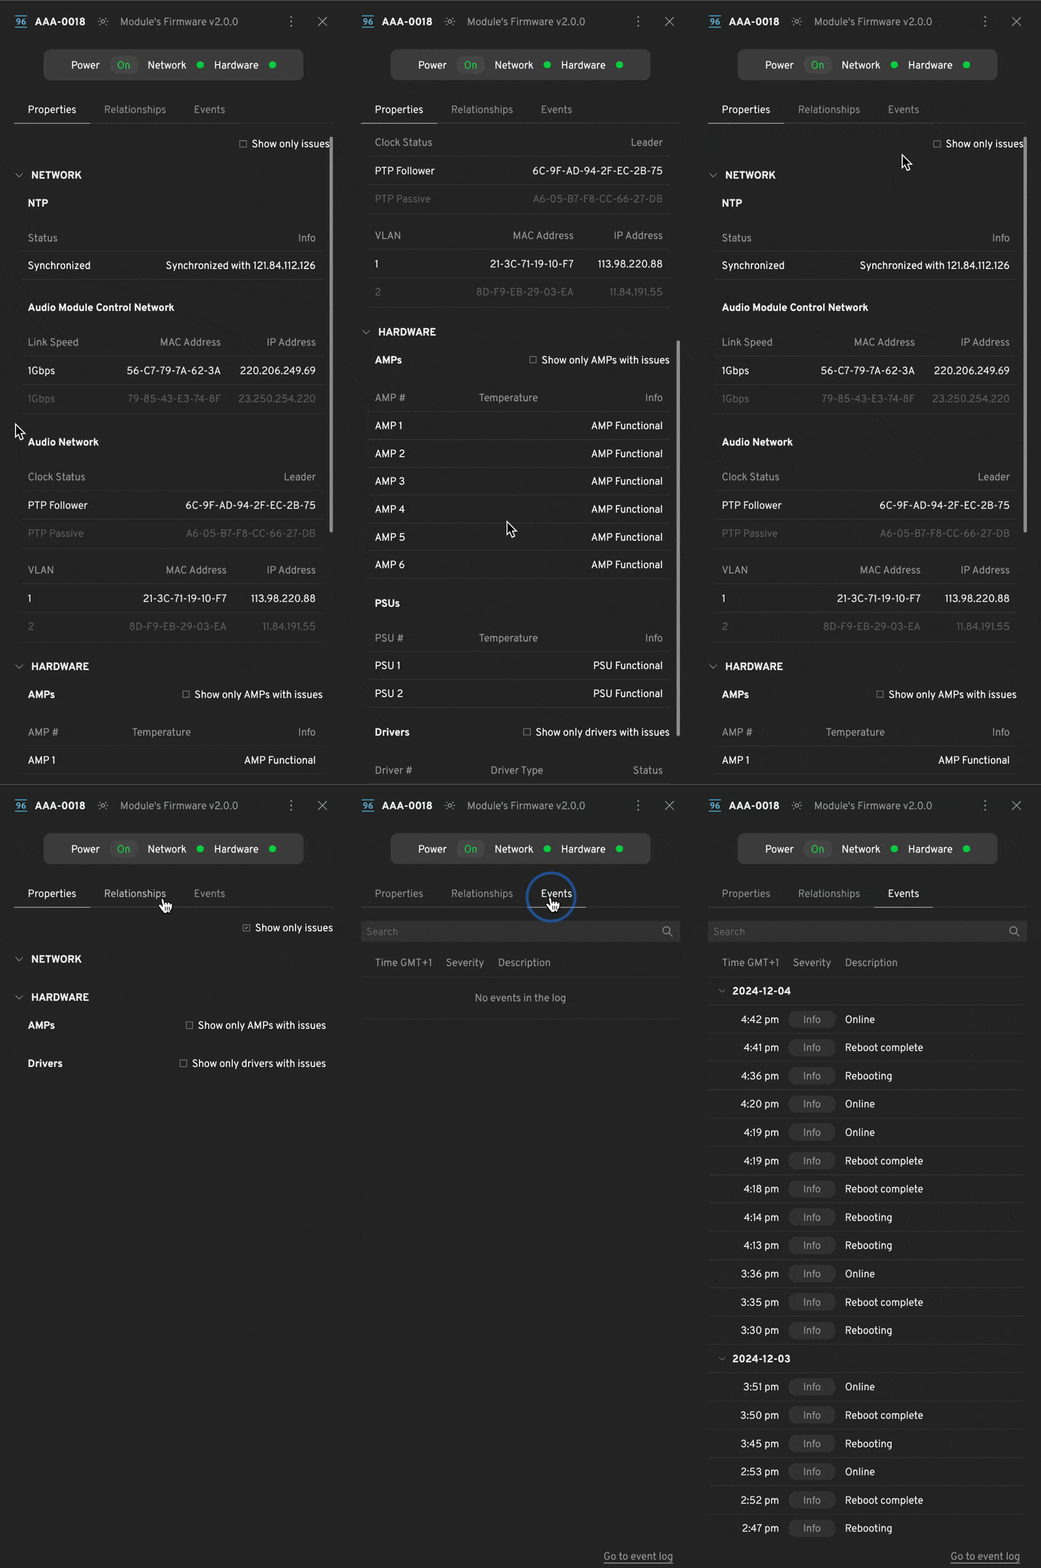
Each module component group has its own logic and calculation approaches. Each outlined component state change generates an event for the respective device.
Power status—Power statuses have no effect on the module's health (e.g., a module can be sleeping and have a network error).
Network interfaces
NTP
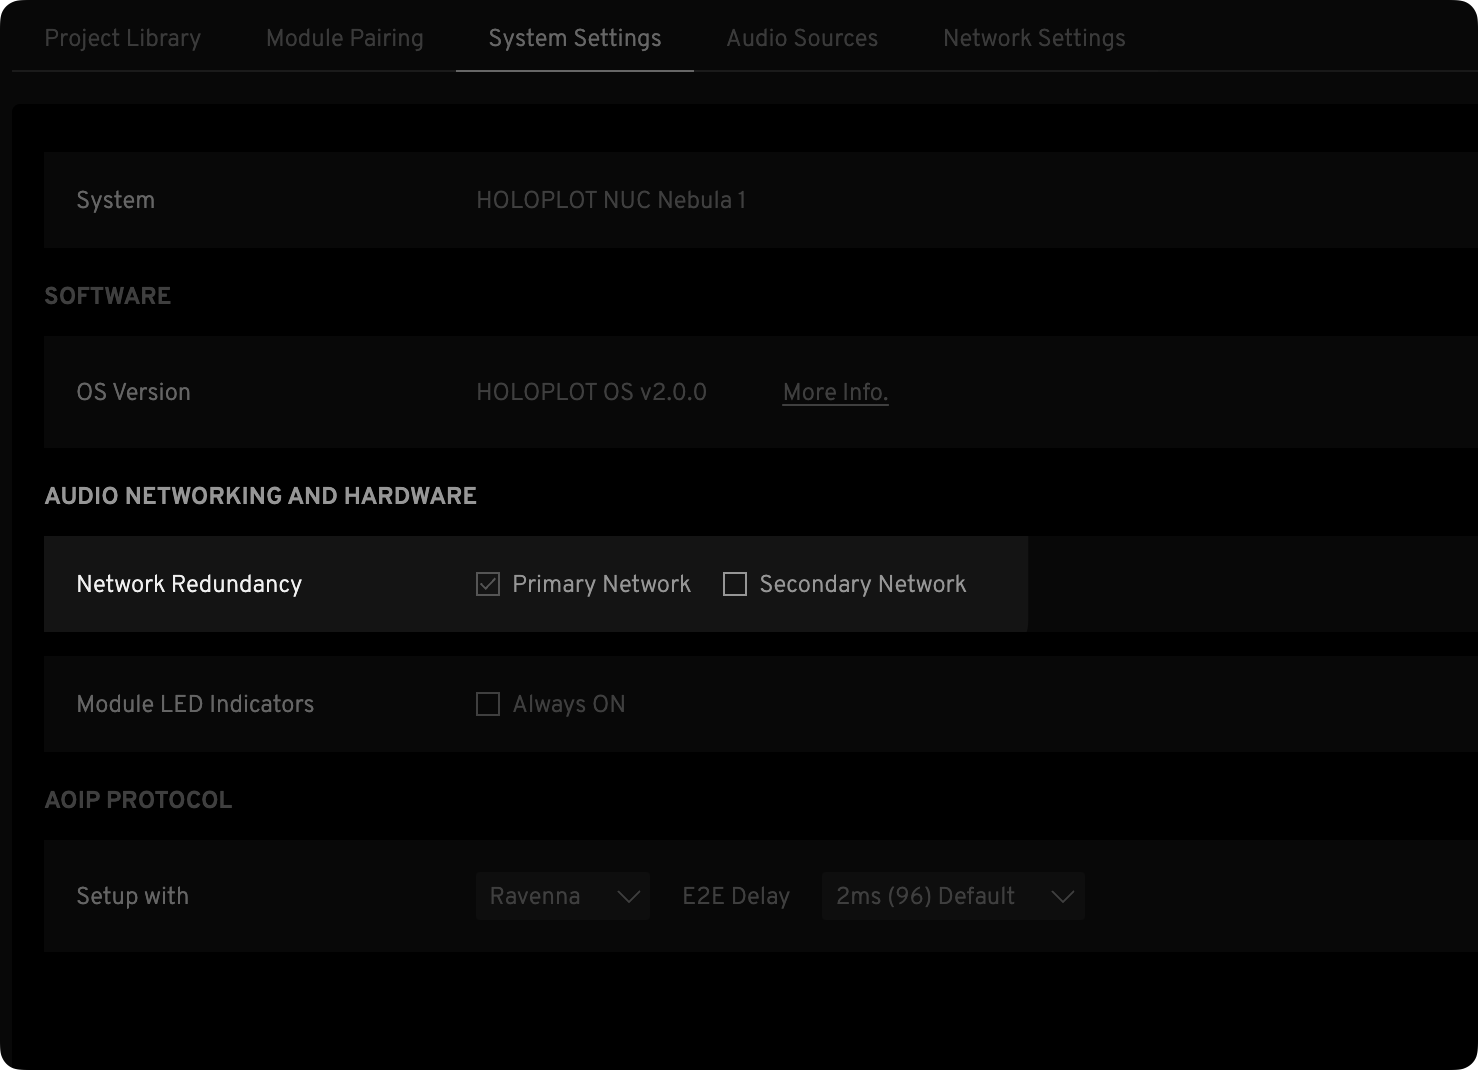
Ravenna and PTP (If Dante is selected as the AoIP protocol, these statuses will not be considered in the health status calculation).
Hardware statuses
Amplifiers
PSUs
Drivers
The all-arrays/system, individual array, and module's health statuses are derived from the aggregation of the different network and hardware statuses using the thresholds below:
🟢
–
–
–
–
🟡
1%
5%
5%
1%
🟠
10%
30%
–
30%
🔴
30%
50%
–
50%
The module's health is evaluated based on network and hardware statuses, which are derived from the aggregation of the aforementioned criteria. The highest severity level among these statuses determines the overall health of the module's network and hardware.
The single array health is an aggregation of the hardware and network statuses of the modules inside a specific array. The highest severity of its components defines the health status shown in HOLOPLOT Control.
The arrays' health is a single status derived from the health of all the system's arrays, using the thresholds mentioned above.
Calculating the health of controllers follows a similar approach to modules and arrays, although with different components and thresholds.
Each controller component group has its own logic and calculation approaches. Each outlined component state change generates an event for the respective device.
Online status
Network status
Connectivity
HOLOPLOT Cloud
NTP
Network
Audio Module Control Network: It enables communication between the audio modules and the controllers for system management, operation, and configuration.
HOLOPLOT Control Network: It provides connectivity for HOLOPLOT Control and the Public System API, supporting user interaction and external system integration.
Audio Network: It supports Audio over IP monitoring services specifically for RAVENNA installations. It detects audio stream announcements and monitors audio streams to facilitate failover mechanisms.
Intercontroller Network: It facilitates the communication between HOLOPLOT controllers to synchronize their states and ensure redundancy in system operations.
Hardware status
Drives
Fans
PSUs
The controller health statuses are derived from the aggregation of the different network and hardware statuses using the thresholds below:
Each module component group has its own logic and calculation approaches. Each outlined component state change generates an event for the respective device.
🟢
–
–
–
–
🟡
1%
10%
10%
1%
🟠
10%
30%
–
30%
🔴
50%
80%
–
50%
This status refers to the web browser's connection to the system, which is visible only on the footer.
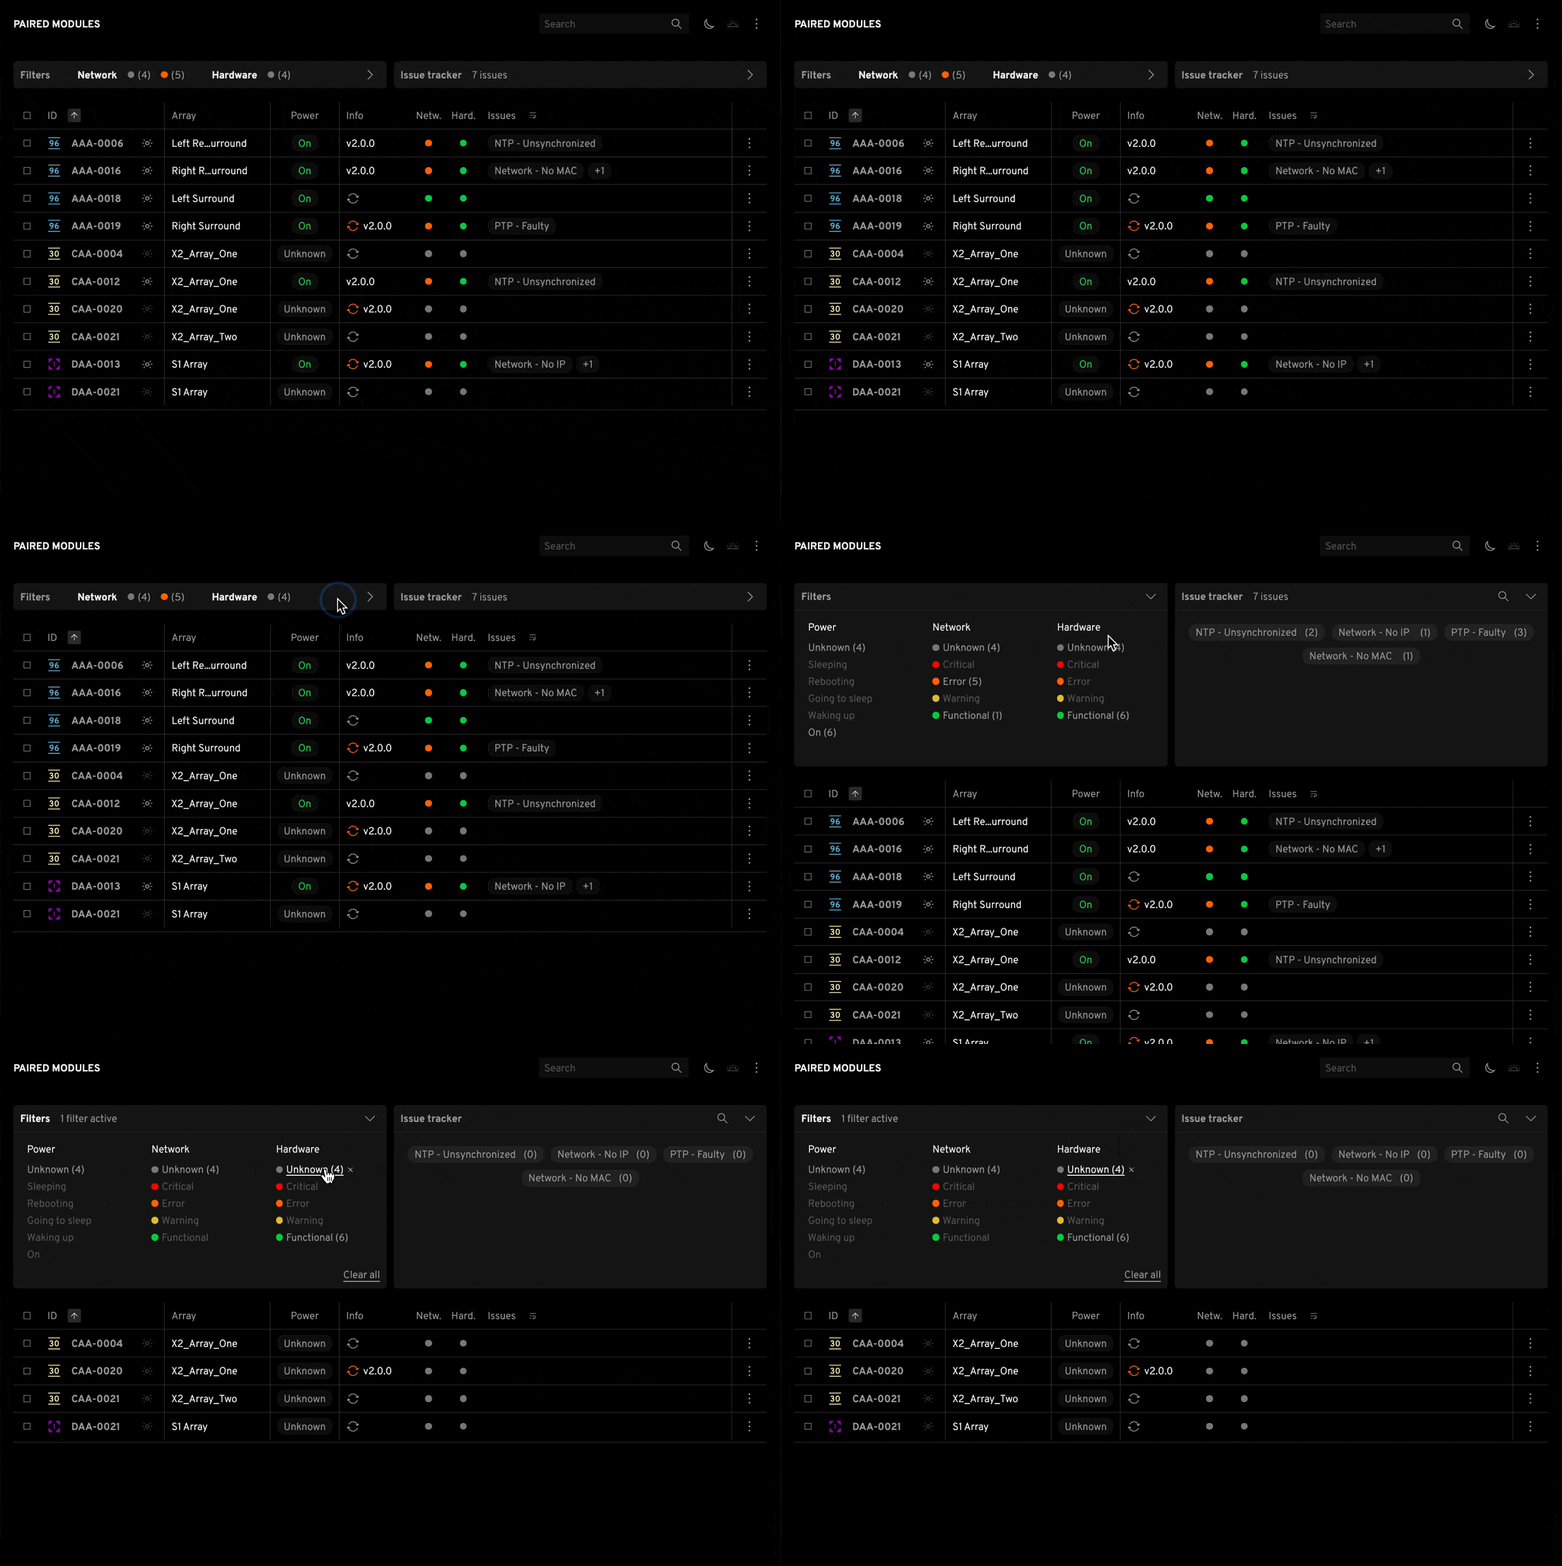
When navigating to the Device List, the right panel shows 2 collapsed cards: the filters and the issue tracker. They can be used together or independently.
The filter has two functions:
When collapsed, it allows for monitoring of the Network and Hardware statuses.
When expanded, it allows for filtering based on Power, Network, and Hardware statuses to quickly identify system failures during debugging.
Whenever there's an issue affecting the network or hardware status, the specific issue will be displayed on the Issue Tracker in the following format Type – Issue description.
Click the issue to filter the modules with that specific issue.